


What is the difference between data and information? Data is a collection of raw facts, figures, or observations. Information is data that has been processed, organized, and given context so that it becomes meaningful and useful.
For example, the numbers 72, 81, 85, and 90 are just individual scores that’s data. Once you calculate that the average score is 82, you have information: something that actually tells you how a student performed.
Understanding this difference matters more than it might seem. It shapes how we think in computer science, data analytics, business, education, information systems, artificial intelligence, and everyday decision-making. Get the distinction right, and concepts like big data, business intelligence, and data-driven decisions suddenly make a lot more sense.
This guide breaks the difference between data and information down in plain English, with simple comparison tables, real-world examples, and answers to the questions people actually search for.
What Is Data?
Data is the raw material. It’s a collection of individual facts, figures, observations, or measurements that haven’t been processed or interpreted yet.
Data doesn’t have to be numbers. It can take many forms:
- Numbers (test scores, prices, temperatures)
- Text (customer reviews, survey responses)
- Symbols (codes, categories, tags)
- Images (photographs, scans, screenshots)
- Audio (voice recordings, call logs)
- Video (security footage, video calls)
- Measurements (weight, distance, time)
- Observations (a nurse noting a patient’s pulse)
- Records (transaction logs, attendance sheets)
On its own, a single piece of data doesn’t tell you much. The number “76” means nothing until you know what it represents.
Characteristics of Data
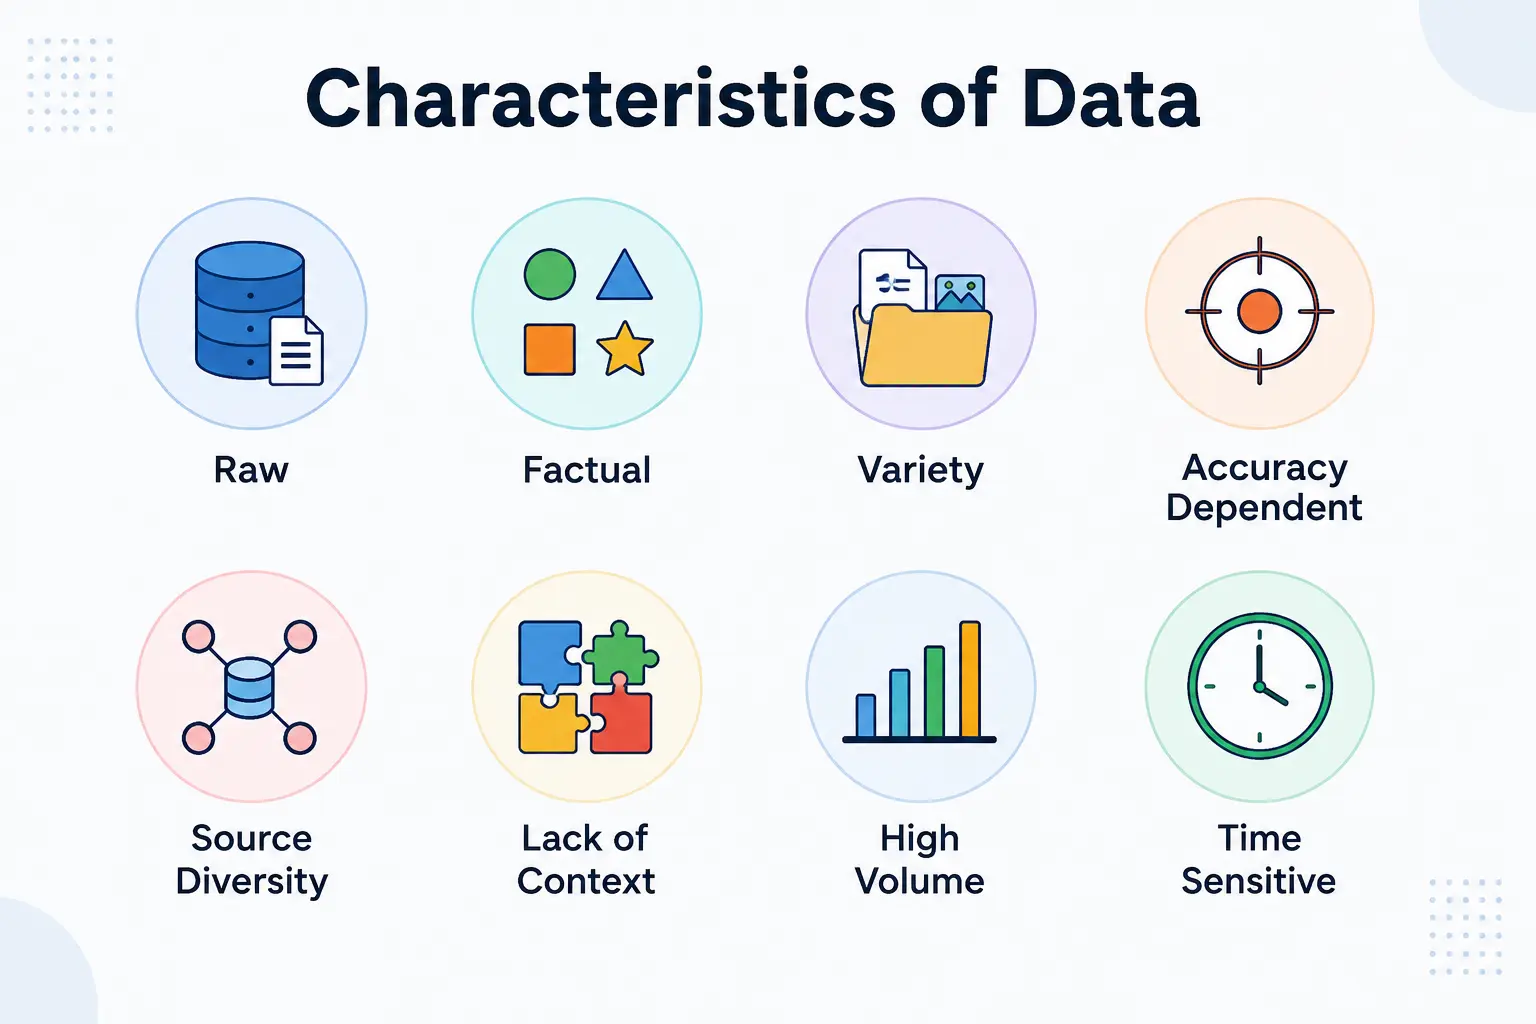
A few traits show up again and again when you look at raw data:
- Raw or unprocessed – it hasn’t been analyzed or interpreted yet
- Individual facts or observations – each data point stands alone
- Can exist in different formats – text, numbers, images, and more
- May lack context – a number without a label is hard to interpret
- Used as input – data feeds into processing and analysis
- Can be collected from multiple sources – sensors, forms, systems, people
Types of Data
Not all data looks the same. Here are the main categories worth knowing:
- Quantitative data – numerical values you can measure or count, like age, revenue, or temperature.
- Qualitative data – descriptive, non-numerical information, like customer feedback or interview notes.
- Structured data – organized into a clear format, like rows and columns in a spreadsheet or database.
- Unstructured data – has no predefined format, like emails, videos, or social media posts.
- Semi-structured data – has some organizational structure but isn’t as rigid as structured data, like a JSON file or an email with metadata tags.
These types often overlap in real projects. A single dataset might combine structured sales figures with unstructured customer comments.
What Is Information?
Information is what you get once data has been processed, organized, interpreted, or presented in a way that adds context. It answers a question or supports a decision.
Where raw data sits passively, information does something. It helps people:
- Understand a situation
- Identify patterns
- Answer specific questions
- Compare results over time
- Make informed decisions
Characteristics of Information
Useful information tends to share these qualities:
- Meaningful – it says something, rather than just existing
- Organized – structured in a way that makes sense
- Contextual – tied to a specific situation or question
- Relevant – connected to what the reader actually needs
- Useful – can be acted on
- Interpretable – a person can understand it without extra explanation
- Supports decision-making – gives people something to act on
Example of Information
Take this raw dataset: 72, 75, 80, 85, 90.
By itself, that’s just five numbers. But once you look at them in sequence and describe the pattern, you get information:
“The student’s scores improved steadily across five tests.”
That single sentence does more work than the five numbers ever could on their own. It tells a story, and that’s the core difference between data and information in action.
Difference Between Data and Information
This is the heart of the topic, so let’s be direct about it.
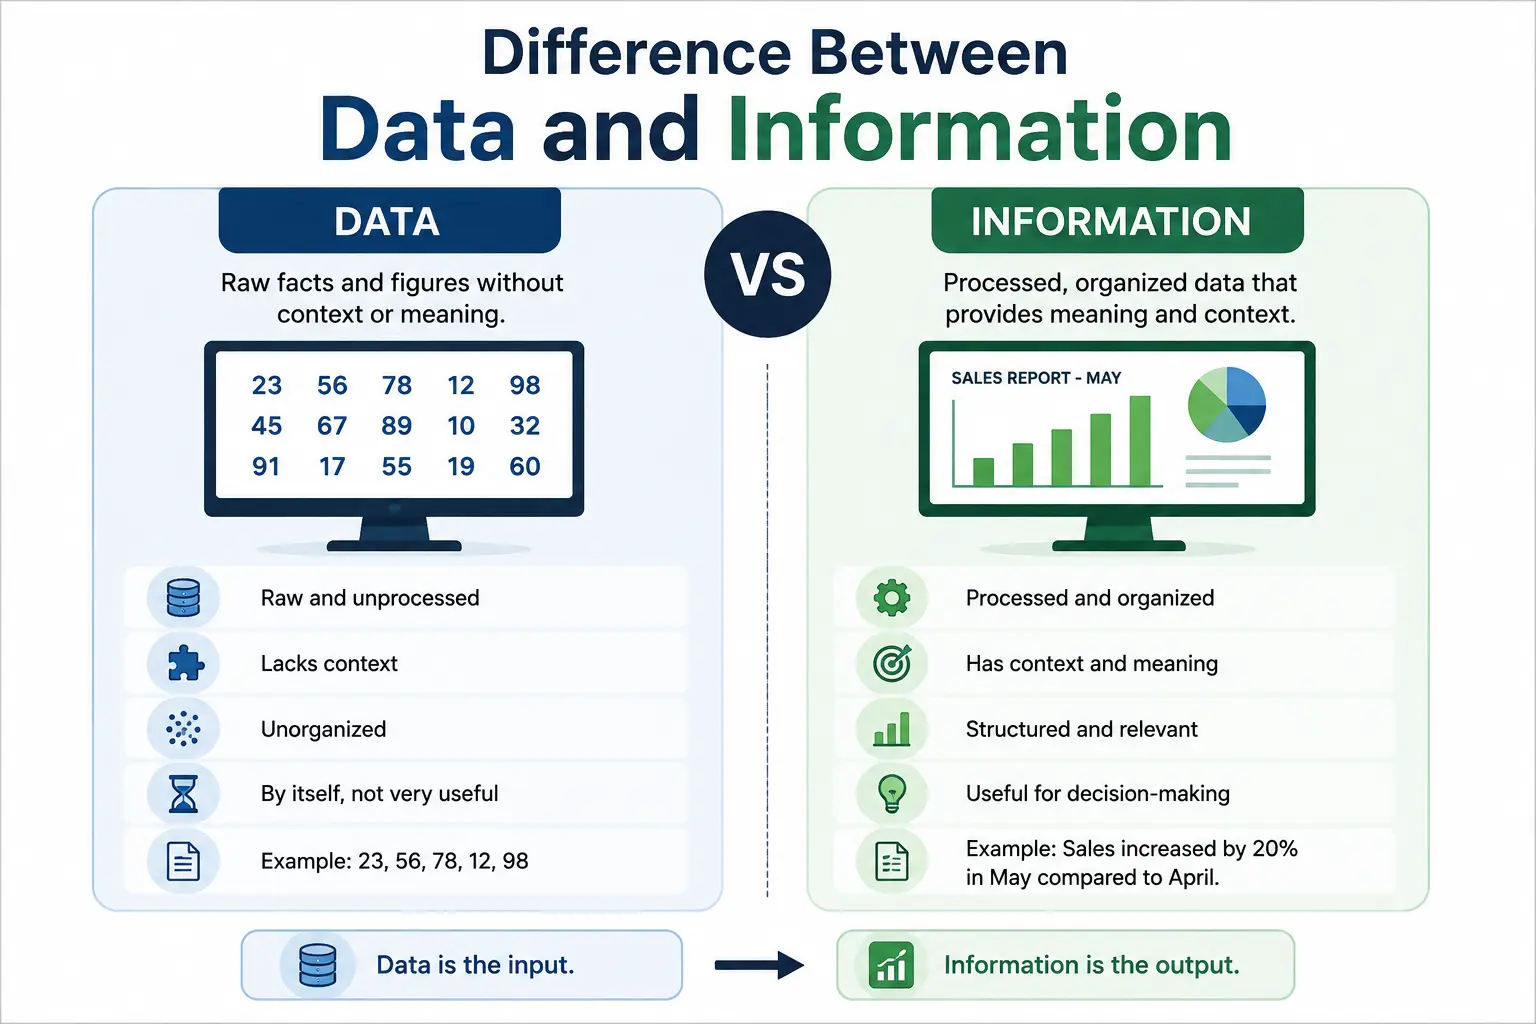
The main difference between data and information is that data consists of raw facts or observations, while information is processed and organized data that provides meaning and context.
Data is the input. Information is the output. Everything else follows from that one relationship.
Here’s a full side-by-side comparison:
| Basis | Data | Information |
|---|---|---|
| Meaning | Raw facts and observations | Processed and meaningful data |
| Processing | Usually unprocessed | Processed and organized |
| Context | May lack context | Provides context |
| Purpose | Used as input for analysis | Used to understand and make decisions |
| Structure | Can be unorganized | Usually organized |
| Dependency | Can exist independently | Derived from data |
| Usefulness | May not be immediately useful | Directly useful |
| Decision-making | Doesn’t usually provide conclusions by itself | Helps support decisions |
| Example | Individual student scores | Average class performance |
| Relationship | Input | Output |
If you remember nothing else from this table, remember this: data is what you collect, and information is what you understand.
Data vs Information: Simple Examples
Definitions only go so far. Seeing the transformation happen in different contexts makes the difference between data and information click.
Student Grades Example
Data:
- Ali: 75
- Ahmed: 82
- Sara: 91
- Zain: 68
On their own, these are just four numbers attached to four names. There’s no story yet.
Information:
“Sara achieved the highest score, while Zain received the lowest score.”
Once the numbers are compared against each other, they become meaningful. That comparison — not the numbers themselves — is what turns data into information.
Sales Example
Data:
- January: ₹50,000
- February: ₹55,000
- March: ₹62,000
Information:
“Sales increased every month during the first quarter.”
A business owner can’t act on three isolated figures. But a clear upward trend? That’s something they can plan around.
Weather Example
Data:
- 28°C
- 31°C
- 33°C
- 35°C
Information:
“The temperature increased steadily throughout the period.”
Website Analytics Example
Data:
- 10,000 visitors
- 500 conversions
- 5% conversion rate
Information:
“The website converted 5% of its visitors into customers.”
This last example is especially useful for anyone working in digital marketing or analytics, where raw traffic numbers are meaningless without a conversion rate to give them context.
How Does Data Become Information?
Data doesn’t turn into information by accident. It goes through a fairly predictable process.
- Data Collection – Raw data comes from many places: surveys, transactions, sensors, websites, databases, applications, social media, and customer interactions.
- Data Cleaning – Before data is useful, it usually needs cleanup. This includes removing duplicates, correcting errors, handling missing values, and standardizing formats (so “USA,” “U.S.,” and “United States” don’t get treated as three different entries).
- Data Organization – Clean data gets sorted, categorized, grouped, or structured — for example, arranging transactions by date or grouping customers by region.
- Data Analysis – This is where patterns and relationships emerge, through calculations, statistical analysis, comparisons, aggregation, or visualization.
- Interpretation – Analyzed results get context. A 15% increase means little until you know it’s a 15% increase in sales compared to last quarter.
- Information Presentation – Finally, the results are shared in a usable form: reports, charts, dashboards, summaries, tables, or recommendations.
Here’s the whole process in one line:
Data → Cleaning → Organization → Analysis → Interpretation → Information
Skip a step – especially cleaning – and the resulting “information” can be misleading, even if the analysis itself looks sound.
Relationship Between Data and Information
The relationship is straightforward once you see it laid out:
Data → Processing → Information → Knowledge → Decision
Data is the foundation. Information is the meaningful result you get after that foundation is processed and interpreted. Neither one replaces the other — they depend on each other. Without data, there’s nothing to process. Without processing, data stays raw and hard to use.
Data vs Information vs Knowledge
The difference between data and information is usually just the first step in a bigger chain. Once you add a third concept knowledge the picture becomes even clearer.
| Concept | Simple Meaning | Example |
|---|---|---|
| Data | Raw facts | 80, 85, 90 |
| Information | Meaningful interpretation of data | Average score is 85 |
| Knowledge | Understanding gained from information | The student is performing consistently well |
Data tells you what happened. Information tells you what it means. Knowledge tells you what to do about it — or at least gives you the understanding to figure that out.
Where Does Wisdom Fit?
Some frameworks extend the chain one step further:
Data → Information → Knowledge → Wisdom
Wisdom is the ability to apply knowledge well — knowing not just that a student is consistently strong, but knowing how to support them further. This is part of what’s known as the DIKW hierarchy, a framework worth exploring in more depth on its own.
Why Is the Difference Between Data and Information Important?
Understanding this distinction isn’t just academic. It has real, practical consequences.
Better Decision-Making
Isolated numbers don’t guide decisions well. Information gives decision-makers context, which is what actually makes a number actionable.
Better Business Analysis
Businesses rely on information – not raw data – to identify:
- Sales trends
- Customer behavior
- Market changes
- Operational problems
Better Understanding
Information compresses large quantities of data into something people can actually grasp. Nobody wants to read ten thousand rows of a spreadsheet; they want the three-sentence summary.
Improved Planning
Organizations plan future activities based on meaningful information, not scattered data points. A single sales figure doesn’t tell you much about next quarter. A trend does.
Better Data Analytics
Analysts spend most of their time working with raw datasets, but their job isn’t done until that work produces meaningful information and insights that someone else can use.
Examples of Data and Information in Different Fields
The pattern raw facts becoming meaningful context repeats across nearly every industry.
Data and Information in Business
Data: Individual sales transactions Information: Monthly sales increased by 15%.
Data and Information in Education
Data: Individual student scores Information: The class average increased from 70% to 78%.
Data and Information in Healthcare
Data: Individual test results and vital measurements Information: A patient’s measurements show a particular trend over time useful for spotting early warning signs.
Data and Information in Finance
Data: Individual stock prices Information: The stock has increased by 12% over the month.
Data and Information in Marketing
Data: Clicks, impressions, conversions Information: Search traffic generated more conversions than social traffic a useful insight for budget planning.
Data and Information in Technology
Data: Server logs and system events Information: Traffic increased significantly during a particular period, which might point to a product launch or a security issue worth investigating.
What Are the Main Characteristics of Good Information?
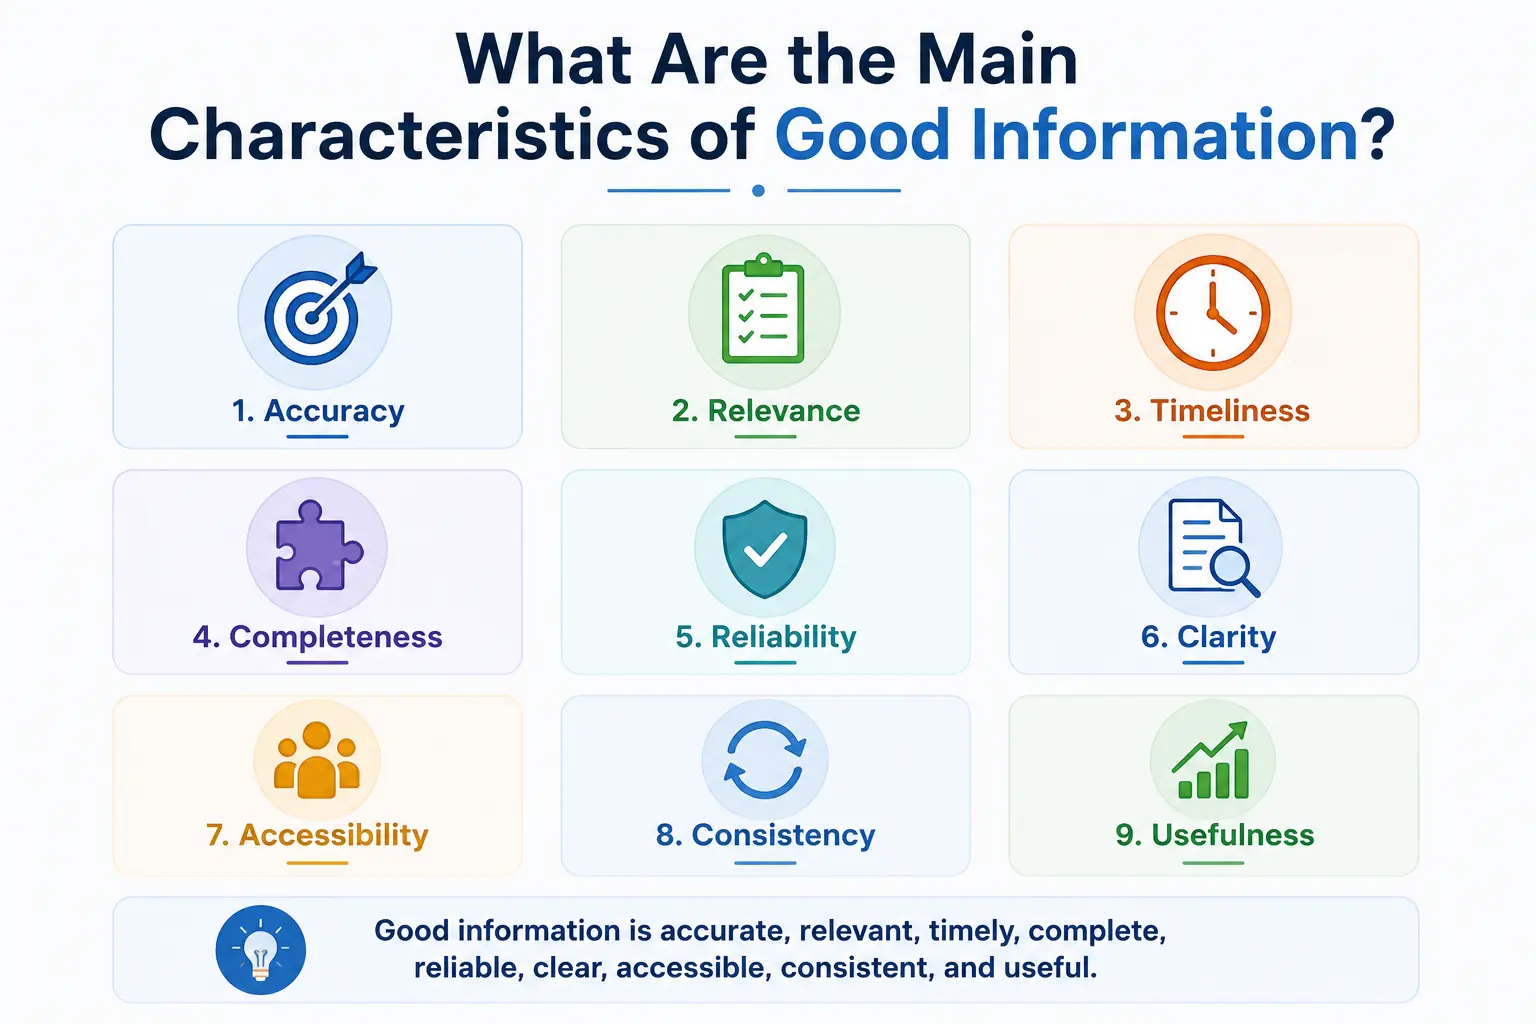
Not every piece of processed data qualifies as good information. Quality matters as much as the processing itself. Good information tends to be:
- Accurate – free from significant errors
- Relevant – connected to the actual question at hand
- Timely – available when it’s needed, not after the decision has already been made
- Complete – covers what’s necessary without leaving out key context
- Reliable – comes from a trustworthy source or process
- Accessible – easy for the intended audience to find and use
- Clear – presented in a way people can actually understand
Simply processing data doesn’t automatically make the result useful. For example, outdated sales data may be correctly averaged and organized, yet still lead to poor business decisions if the market has since shifted. Good processing and good information aren’t the same thing.
Can Data Exist Without Information?
Yes. Data can exist completely on its own, with no information attached to it at all.
A spreadsheet full of unlabeled numbers is still data, even if nobody has looked at it or drawn any conclusions from it. Information, on the other hand, normally depends on data being organized and interpreted it doesn’t usually appear out of nowhere.
That said, raw data without context can have very little practical meaning. And it’s worth noting that not every transformation of data produces useful information quality, accuracy, and relevance still matter. Turning data into information is necessary, but it isn’t automatically sufficient.
Is Information Always Derived From Data?
In everyday language, “information” can mean lots of things a rumor, a fact someone tells you, a general piece of knowledge. Outside of computing, the term is used pretty loosely.
But within information systems and data analytics specifically, information is commonly understood as processed or contextualized data. In that narrower, technical sense, yes information is derived from data. It’s worth keeping in mind that the simplified version of this rule (“information always comes from data, no exceptions”) holds well in a technical context, but isn’t necessarily how the word is used everywhere.
Common Confusion Between Data and Information
A few misunderstandings come up often enough to be worth addressing directly.
Data Is Not Always Numbers
People often picture data as spreadsheets full of digits. In reality, data includes text, images, audio, video, sensor readings, and symbols anything that represents a fact or observation.
Processed Data Is Not Automatically Useful Information
Running data through a process doesn’t guarantee the result is useful. Context, accuracy, relevance, and purpose all determine whether the output actually qualifies as good information.
Data and Information Are Related but Not Identical
They work together, but they aren’t interchangeable terms. Data is the raw input; information is the meaningful output. Confusing the two makes it harder to talk clearly about analytics, reporting, or decision-making.
Data and Information in the Age of AI
Artificial intelligence has made the difference between data and information more relevant than ever, not less.
- AI models are trained on data huge volumes of it.
- That data needs preparation (cleaning, labeling, structuring) before it can be used effectively.
- Information provides the context that helps humans interpret what an AI model produces.
- Poor-quality data leads to unreliable outputs, no matter how advanced the model is.
- Organizations that want dependable AI results need accurate, relevant, and well-managed data as a foundation.
The old saying “garbage in, garbage out” applies just as much to AI systems as it did to early data processing. Good information has always depended on good data AI hasn’t changed that relationship, it’s just raised the stakes.
Frequently Asked Questions About the Difference Between Data and Information
What is the difference between data and information?
Data consists of raw, unprocessed facts, figures, or observations. Information is data that has been processed, organized, and placed into context so it becomes meaningful and useful for understanding or decision-making. In short: data is the input, and information is the output.
What is an example of data and information?
Individual test scores 72, 81, 85, 90 are data. Calculating that the average score is 82 turns those numbers into information, since it now tells you something meaningful about overall performance.
Is data raw information?
Not quite. Data is raw material, but it isn’t information yet it hasn’t been processed or given context. Calling it “raw information” blurs a distinction that’s actually useful to keep clear: information specifically refers to data after it has been organized and interpreted.
How does data become information?
Data becomes information through a process of collection, cleaning, organization, analysis, and interpretation. Once that processed data is presented with context as a summary, chart, or conclusion it becomes information.
What are the 5 differences between data and information?
The five core differences are:
- Meaning – data is raw facts; information is processed and meaningful.
- Processing – data is usually unprocessed; information is processed and organized.
- Context – data may lack context; information provides it.
- Purpose – data is input for analysis; information supports understanding and decisions.
- Decision-making – data alone rarely leads to conclusions; information directly supports them.
What is the relationship between data and information?
Data serves as the input, and information is the meaningful result that comes out after that data has been processed and interpreted. One depends on the other you can’t have information without data, but data can exist without ever being turned into information.
What is the difference between data, information, and knowledge?
Data is raw facts (test scores of 80, 85, 90). Information is the meaningful interpretation of that data (the average score is 85). Knowledge is the deeper understanding gained from that information (this student performs consistently well). Each stage builds on the one before it.
Why is information more useful than raw data?
Information is more useful because it provides context that raw data lacks on its own. A single number rarely tells a complete story, but information built from patterns, comparisons, and interpretation gives people something they can actually understand and act on.
Conclusion
The difference between data and information comes down to one core idea: data is raw facts and observations, while information is that same data after it has been processed, organized, and given context.
Data is the foundation the individual scores, transactions, or measurements collected from the world around us. Information is what emerges once that raw material is cleaned, organized, analyzed, and interpreted into something meaningful. One provides the material; the other provides the meaning.
This transformation isn’t optional if you want to make good decisions. A pile of numbers can’t tell you whether sales are improving, whether a student is struggling, or whether a website is converting visitors effectively. Only information data with context can do that.
The next time you’re staring at a spreadsheet, a dashboard, or a report, ask yourself which one you’re actually looking at. If it’s just numbers without a story, you’re still working with data. Once you can explain what those numbers mean and what to do about them, you’ve turned it into information and that’s where good decisions actually start.